%matplotlib inline
import matplotlib.pyplot as plt
import torch
The common activation functions
deep learning
math
Basic math for deep learning
Why we need activation functions?
Activation functions decide whether a neuron should be activated or not. They are differentiable, then the information can be carried between the inputs and outputs. In practice, most of the actication functions are non-linearity.
The common activation functions
ReLU function
\[ReLU(x) = max(x,0)\]
x = torch.arange(-10.0, 10, 0.1, requires_grad=True)
y = torch.relu(x)
y.backward(torch.ones_like(x), retain_graph=True)
x.shape, x.grad.shape, y.shape(torch.Size([200]), torch.Size([200]), torch.Size([200]))fig, axs = plt.subplots(1, 2, figsize=(10, 3))
flat_axs = axs.flatten()
flat_axs[0].plot(x.detach(), y.detach())
flat_axs[0].set_title('ReLU')
flat_axs[0].set_xlabel('x')
flat_axs[0].set_ylabel('y')
flat_axs[1].plot(x.detach(), x.grad)
flat_axs[1].set_title('grad of ReLU')
flat_axs[1].set_xlabel('x')
flat_axs[1].set_ylabel('grad of y')
plt.tight_layout()
plt.show()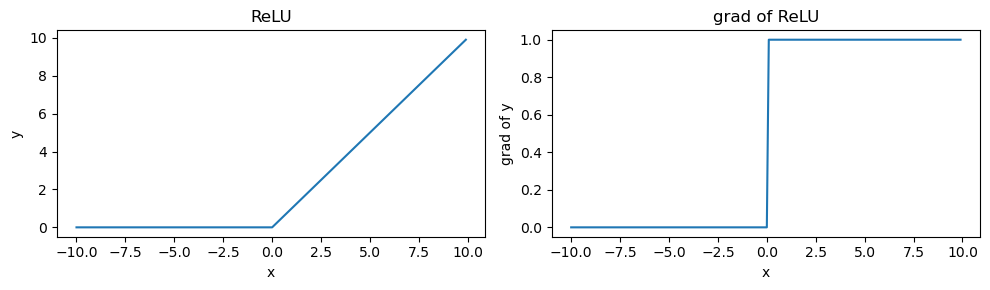
Sigmoid function
\[sigmoid(x) = \frac{1} {1 + e^{-x}}\]
x.data.zero_()
x = torch.arange(-10.0, 10, 0.1, requires_grad=True)
y = torch.sigmoid(x)
y.backward(torch.ones_like(x), retain_graph=True)
fig, axs = plt.subplots(1, 2, figsize=(10, 3))
flat_axs = axs.flatten()
flat_axs[0].plot(x.detach(), y.detach())
flat_axs[0].set_title('Sigmoid')
flat_axs[0].set_xlabel('x')
flat_axs[0].set_ylabel('y')
flat_axs[1].plot(x.detach(), x.grad)
flat_axs[1].set_title('grad of Sigmoid')
flat_axs[1].set_xlabel('x')
flat_axs[1].set_ylabel('grad of y')
plt.tight_layout()
plt.show()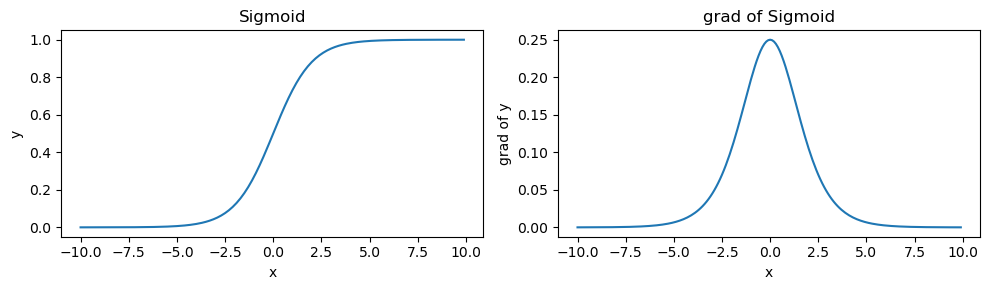
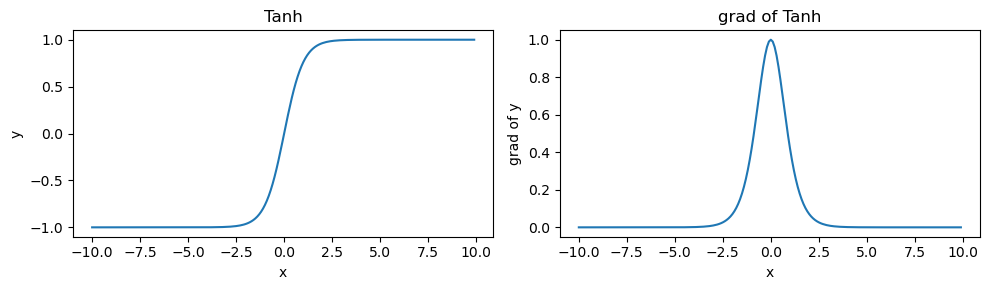
Tanh function
\[tanh(x) = \frac{1 - e^{-2x}} {1 + e^{-2x}}\]
x.data.zero_()
x = torch.arange(-10.0, 10, 0.1, requires_grad=True)
y = torch.tanh(x)
y.backward(torch.ones_like(x), retain_graph=True)
fig, axs = plt.subplots(1, 2, figsize=(10, 3))
flat_axs = axs.flatten()
flat_axs[0].plot(x.detach(), y.detach())
flat_axs[0].set_title('Tanh')
flat_axs[0].set_xlabel('x')
flat_axs[0].set_ylabel('y')
flat_axs[1].plot(x.detach(), x.grad)
flat_axs[1].set_title('grad of Tanh')
flat_axs[1].set_xlabel('x')
flat_axs[1].set_ylabel('grad of y')
plt.tight_layout()
plt.show()